
Analytics are an important tool for helping you determine who your website visitors are and why they are coming to your website. But did you know they can also help you increase online bookings for your tour and activity business? Without some form of analytics, the chances are you are missing out on valuable data that you can use to determine what content is most important to your online visitors and how best to drive them towards online booking.

Photo Credit: http://www.flickr.com/photos/titanas/8352719853/
What are Analytics?
If you are like most small business owners, your first question is probably “What the heck are analytics?”. To put is simply, an analytics program is one that tracks activity on your website, analyses it for you, and then presents the results in a human readable format (most of the time). Analytics programs and services usually use a small snippet of javascript code that is placed on your website to track visitors to your website. This code is something that either you or your web designer usually has to place on your website. If you are using a content management system like WordPress, there are plugins that you can use to simplify the process. In all cases, however, you still have to copy and paste the code snippet from the analytics provider and paste it into your site somewhere.
At Rezgo, we use a variety of analytics tools to measure and compare visitor information. For our marketing website and support sites, we use a combination of Google Analytics, Alexa Pro, and HitsLink. All three services offer slightly different information and it’s nice to be able to compare the results against each other (for verification and validation purposes).
Which Analytics Provider Should I Use?
There are many analytics providers, but by far the best and most comprehensive is Google Analytics. It is also a free service, so the cost benefit is pretty clear. The only downside to Google’s offering is that it can be quite daunting for a non-technical person to understand all the features provided in the service or, for that matter, what to do with the information once you have it.
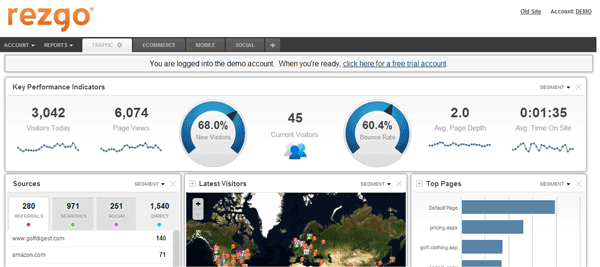
Another good choice, that is relatively inexpensive for a small website owner, is HitsLink. The HitsLink dashboard is much easier to read and provides snapshot data in an easy to understand way. You still have the ability to dive deeper into the data if you like, but the basics are there, in your face without being overwhelming.
One of the nicest features of HitsLink is the simplicity with which they have integrated the conversion tracking and ecommerce goals. The javascript code, for example, can be easily added to your Rezgo account. The best part is that the ORDER TOTAL values and ORDER ID fields are automatically updated by Rezgo with the correct values, so you get up to the minute details of conversion values in your dashboard.
When you set-up your account on either Google Analytics or HitsLink, be sure to add the analytics code snippet to all pages on your site include your Rezgo account. You can always refer to this article if you need help adding analytics code to Rezgo.
What should you look for?
1. Search Terms / Keywords – Chances are when you take a look at your reports, you’ll find that a high percentage of traffic is coming from Google. How those customers find your website and what search terms they are using will give you a good sense for what your customers are searching for in the major search engines. You may find that you are ranking really high for a completely unrelated term and, as a result, you are getting a lot of traffic to your home page but those same visitors are leaving right away. This will be reflected in your bounce rate.
2. Bounce Rate – This value tells you what percentage (on average) of your visitors come to your site, views only one page, and then immediately leaves again. The goal is to capture that visitor and have them look at other pages of your site. If the visitor is truly interested in your tours or activities, they will most likely visit other pages on your site looking for information that is important for them. When they do leave your site, you will want to know where, since you may want to find a way to change the content on that page to be more engaging or reduce the likelihood of that page being a major exit page.
3. Exit Pages – These are the pages from which your visitors exit your site. Understanding where your customers are leaving can give you a good idea about how to keep them from leaving. Take a look at your top exit pages and see if you can determine why someone might leave your site from that page. If your home page is top exit page, that may be an indicator that the visitor you are attracting is simply not interested in your tours or activities. If your top exist page is a tour page, then perhaps your tour or activity is not being described in the best way. Perhaps, you don’t have a clear call to action on the page for them to continue, in which case, the visitors next best option is to find a competitor that does have a clear call to action.
4. E-commerce activity – Whether you use Google or HitsLink, both will provide you with information about your conversions and where those customers came from. You will be able to see if customers came through Google or another search engine, or if they were referred by another website. The bottom line is, take a good look at where your sales are coming from and what you might be able to do to increase your e-commerce activity from those sources. You may also be able to determine what groups are not converting by looking at regional breakdown of customers. Combining your analytics with targeted advertising campaigns may help to increase your conversions for regions where your conversions are currently low.
5. Mobile vs. Desktop – You will want to keep an eye on the devices that your customers are using to view your site. Tour and activity websites tend to have a higher mobile viewership than other segments of travel, primarily because travelers tend not to use their laptops when traveling. A traveler in a destination looking for things to do is more likely to use a mobile device to search for and book a tour or activity. On average, according to StatsCounter, about 14.62% of web traffic is viewed on a mobile device. Rezgo analytics report mobile viewership at over 27% for the same period. Understanding how your customers are viewing your content can help you determine the best way to get them to book. If your main website is not mobile friendly then it may be turning a large percentage of your customers away before they even get consider doing business with you.
What’s Next?
Once you have had a chance to review your analytics, you can begin to make changes to your site in order to improve conversions on your site. If you are just beginning or have just installed your analytics code, you will need to wait some time to gather enough useful data before taking action. I recommend you give yourself at least a month before making any meaningful changes. Why? Because ultimately, you don’t want to start making changes when you don’t have enough reference data to compare against.
After you have gathered enough usage data to start to view trends in your data, then you can do things like change content, navigation, and landing pages in order to increase or decrease certain metrics. But we’ll save that part for another article. For now, get familiar with your analytics tool of choice and watch.
Written By | Rezgo